Post-pandemic, corporate travel is roaring back. Employees are flying to conferences, board meetings span continents, and “hybrid work” often means mobility requirements most remote-first companies never imagined. Yet while organizations obsess over renewable energy and supply chain emissions, many still treat business travel carbon as a rounding error—unmeasured, untracked, and decarbonized by neither policy nor procurement.
This is a blind spot. For many professional services firms, consulting companies, and multinational enterprises, scope 3 category 6 business travel emissions rank in the top 5 sources of operational carbon footprint. A single transatlantic flight can emit 1–2 tonnes CO₂e per passenger. A busy executive with 20 flights per year is responsible for 20–40 tonnes of personal travel emissions—equivalent to the annual carbon footprint of an average household in developed economies.
Yet scope 3 category 6 business travel remains one of the most data-poor, policy-weak, and often-ignored categories in corporate sustainability programs. This guide walks you through what scope 3 category 6 business travel encompasses, three methods to measure it, and strategies to reduce it without gutting business effectiveness.
Scope 3 Category 6 includes all employee business travel that is neither owned nor operated by your company. Specifically:
Employee commuting (Category 7, not 6): Daily commutes from home to office, whether by car, train, or bus, are Scope 3 Category 7 (Employee Commuting), not Category 6. This is a frequent source of confusion.
Fleet vehicles you own (Scope 1): If your company owns and operates a vehicle fleet for business use, emissions from those vehicles are Scope 1 (direct), not Category 6.
Hotel operations (not your scope): Electricity, heating, and waste from hotels are the hotel’s Scope 1+2, not your Scope 3. You only account for the emissions from traveling to and occupying the room (embodied in transportation).
Virtual meetings: A Zoom call has negligible carbon (attributable to data center energy, already in your Scope 2). No Category 6 entry needed.
Frequent traveler programs: If an employee uses personal frequent flyer miles from a business trip, those emissions still belong in Category 6; the source of the ticket doesn’t change the physics.
Despite being conceptually straightforward, Category 6 measurement is plagued by data challenges:
Stat: A 2023 TCFD survey found that 64% of companies could not provide complete data on their scope 3 category 6 business travel emissions within a 2-week window—compared to 22% for Scope 1+2. This gap explains why scope 3 category 6 business travel is often left blank in sustainability disclosures.
The GHG Protocol offers three approaches to Category 6 measurement, each with trade-offs:
How it works: Multiply total travel spending (in dollars) by an industry-standard or company-specific emission factor (kg CO₂e per dollar spent).
Formula:
Category 6 Emissions = Total Travel Spend ($) × Emission Factor (kg CO₂e/$)
Example: Your company spent $500,000 on business travel in 2025. Using an average emission factor of 0.15 kg CO₂e per dollar spent, your Category 6 emissions = 500,000 × 0.15 = 75,000 kg CO₂e (75 tonnes).
Early-stage companies establishing a first Category 6 baseline, or companies with <$1M annual travel spend where full granularity isn’t material.
How it works: Calculate emissions based on the distance traveled (kilometers or miles) by mode (air, car, train, etc.) using mode-specific emission factors.
Formula:
Category 6 Emissions = Σ (Distance traveled by mode × Emission factor per km)
Example: Your employees flew 500,000 km (averaging 0.11 kg CO₂e/km for commercial flights), drove rental cars 50,000 km (0.12 kg CO₂e/km), and took trains 20,000 km (0.04 kg CO₂e/km).
Mid-size to large enterprises with corporate travel agency relationships that provide detailed itineraries, or companies where air travel is the dominant mode (>80% of Category 6 emissions).
How it works: Record every individual business trip (flight, car rental, hotel) with specific details (origin-destination, class of service, fuel type, occupancy) and use trip-specific emission factors.
Formula:
Category 6 Emissions = Σ (Emissions per trip)
Example:
Large enterprises with 500+ employees, significant business travel (>$5M annually), SBTi targets, or CSRD compliance requirements. The investment pays for itself in better policy design and investor credibility.
Where do you actually find travel data?
| Data Source | Coverage | Pros | Cons |
|---|---|---|---|
| Corporate Travel Agency | Air, car rental, hotel | Complete trip records; pre-calculated distances | Limited to centralized bookings; may not cover all employees |
| Expense Management System | Ground transport, meals, misc. | Captures individual expenses; historical data | Requires manual categorization; incomplete trip context |
| Corporate Credit Card | All travel spending | Universal coverage; detailed merchant data | Mixes travel with non-travel; requires categorization |
| Travel Booking Systems (Concur, TravelPerk, etc.) | Air, car, hotel | Integrated trip data; automated distance calc | Not all companies use centralized systems |
| Airline Frequent Flyer Programs | Domestic/international flights | Precise mileage and class data | Limited to recorded miles; doesn’t capture all travelers |
| Google Maps / OSINT | Any route (if you have O-D pairs) | Accurate distance calculation | Requires manual lookup; time-consuming at scale |
| Employee Self-Report | All modes | Captures ground transport and remote travel | Low accuracy; high burden; poor response rates |
Best practice: Combine multiple sources. Centralized travel agency data provides 60–70% of trips; expense system fills in ground transportation and independent bookings; employee surveys catch gaps. This hybrid approach typically achieves 85–95% coverage.
Once you’re measuring Category 6, the imperative becomes: reduce it. Here are six evidence-backed strategies:
Strategy: Meetings default to video; in-person is exception, not norm.
Impact: Post-pandemic, many companies found that 60–80% of meetings previously requiring travel could work equally well virtually. A consulting firm that reduced in-person meetings from 50% of client interactions to 20% saw Category 6 emissions drop 35%.
Implementation: Train teams on virtual meeting effectiveness; require travel requests to justify business case; provide video conferencing hardware/software; celebrate virtual wins.
Strategy: Batch meetings into fewer, longer trips. Instead of 3 two-day trips, do 1 six-day trip.
Impact: Reduces flights by 50–70% while improving relationship-building and deal velocity. An investment firm that consolidated travel reduced Category 6 by 30% with zero business impact.
Implementation: Travel itinerary planning tools; encourage 4–5 day regional visits; identify hub cities; group client/supplier visits.
Strategy: Prefer trains over flights for routes <800 km; offer ground transport options.
Impact: Train emissions are 80–90% lower per passenger-km than flights. A European professional services firm shifted 15% of short-haul trips from flights to trains, reducing Category 6 by 8%.
Implementation: Partner with rail providers; update travel policy to reimburse train equivalent (not just cheaper airline); calculate CO₂ savings dashboards to build awareness.
Strategy: Limit business class to flights >6 hours; use premium economy otherwise.
Impact: Business class occupies 2–3× more seat space, multiplying per-passenger emissions. A financial services firm’s ban on business class for flights <7 hours cut Category 6 by 12% (and saved $2M annually).
Implementation: Travel policy change; communicate rationale (climate + cost); grandfathered exceptions for executives on rotation require approval.
Strategy: As emissions reduction lags, offset residual Category 6 emissions through verified carbon credits.
Impact: Immediate climate benefit (if using high-quality offsets), visible to employees and investors.
Caution: Offsets are not reduction. They’re a bridge tactic while structural changes take effect. Relying on offsets long-term signals weak decarbonization.
Implementation: Use high-quality offset programs (Gold Standard, Verra); favor carbon removal over carbon avoidance; integrate into travel booking systems for automatic offset on purchase.
Strategy: Purchase SAF blends on certain routes; commit to SAF budget.
Impact: SAF reduces lifecycle emissions by 50–80% vs. jet fuel (depending on feedstock). A tech company committed to 10% SAF on all flights by 2027, reducing Category 6 by ~7% when fully deployed.
Caution: SAF is 2–3× more expensive than conventional jet fuel and currently limited in supply. It’s complementary to reduction, not replacement.
Implementation: Partner with airlines offering SAF options; set annual SAF purchase targets; communicate to stakeholders.
Pre-pandemic business travel assumptions are now obsolete. Consider:
Best practice: Select your baseline year based on your current operating model, not pre-COVID patterns. If 80% of your employees are now distributed, 2022 is a more credible baseline than 2019. Disclose your baseline choice transparently.
1. Forgetting Hotel Embodied Emissions Hotels aren’t just about the flight. Account for 0.05–0.10 tonnes CO₂e per night in hotel accommodation (depending on hotel category and region). Over 100 three-day trips, this adds 15–30 tonnes.
2. Using Aviation Emission Factors Without Radiative Forcing Basic emission factors (0.11 kg CO₂e/km) measure CO₂ only. High-altitude effects (NOx, contrails, cirrus cloud effects) multiply aviation’s warming impact by 2–3×. Use radiative forcing multipliers (typically 2.7×) for 1.5°C-aligned targets and SBTi submissions.
3. Double-Counting Hotel Stays in Scope 2 If a hotel’s Scope 2 electricity is part of your value chain accounting (unlikely unless you own the hotel), don’t also count it in Category 6. However, for most companies, hotel stays in Category 6 should include embodied emissions of accommodation; this is separate from the hotel’s operational Scope 2.
4. Ignoring Ground Transportation Taxis, Ubers, rental cars, and trains are often 10–20% of Category 6 emissions but are frequently omitted because data is scattered. Build ground transportation tracking into your data collection process.
5. Measuring Spouse/Family Travel If your company pays for a spouse’s flight, that’s Category 6. Some companies mistakenly exclude non-employee travel. If you’re paying, it’s your Scope 3.
Manual Category 6 measurement is labor-intensive: collecting data from travel agencies, expense systems, and credit card platforms, manually matching trips, calculating distances, applying factors. Errors accumulate.
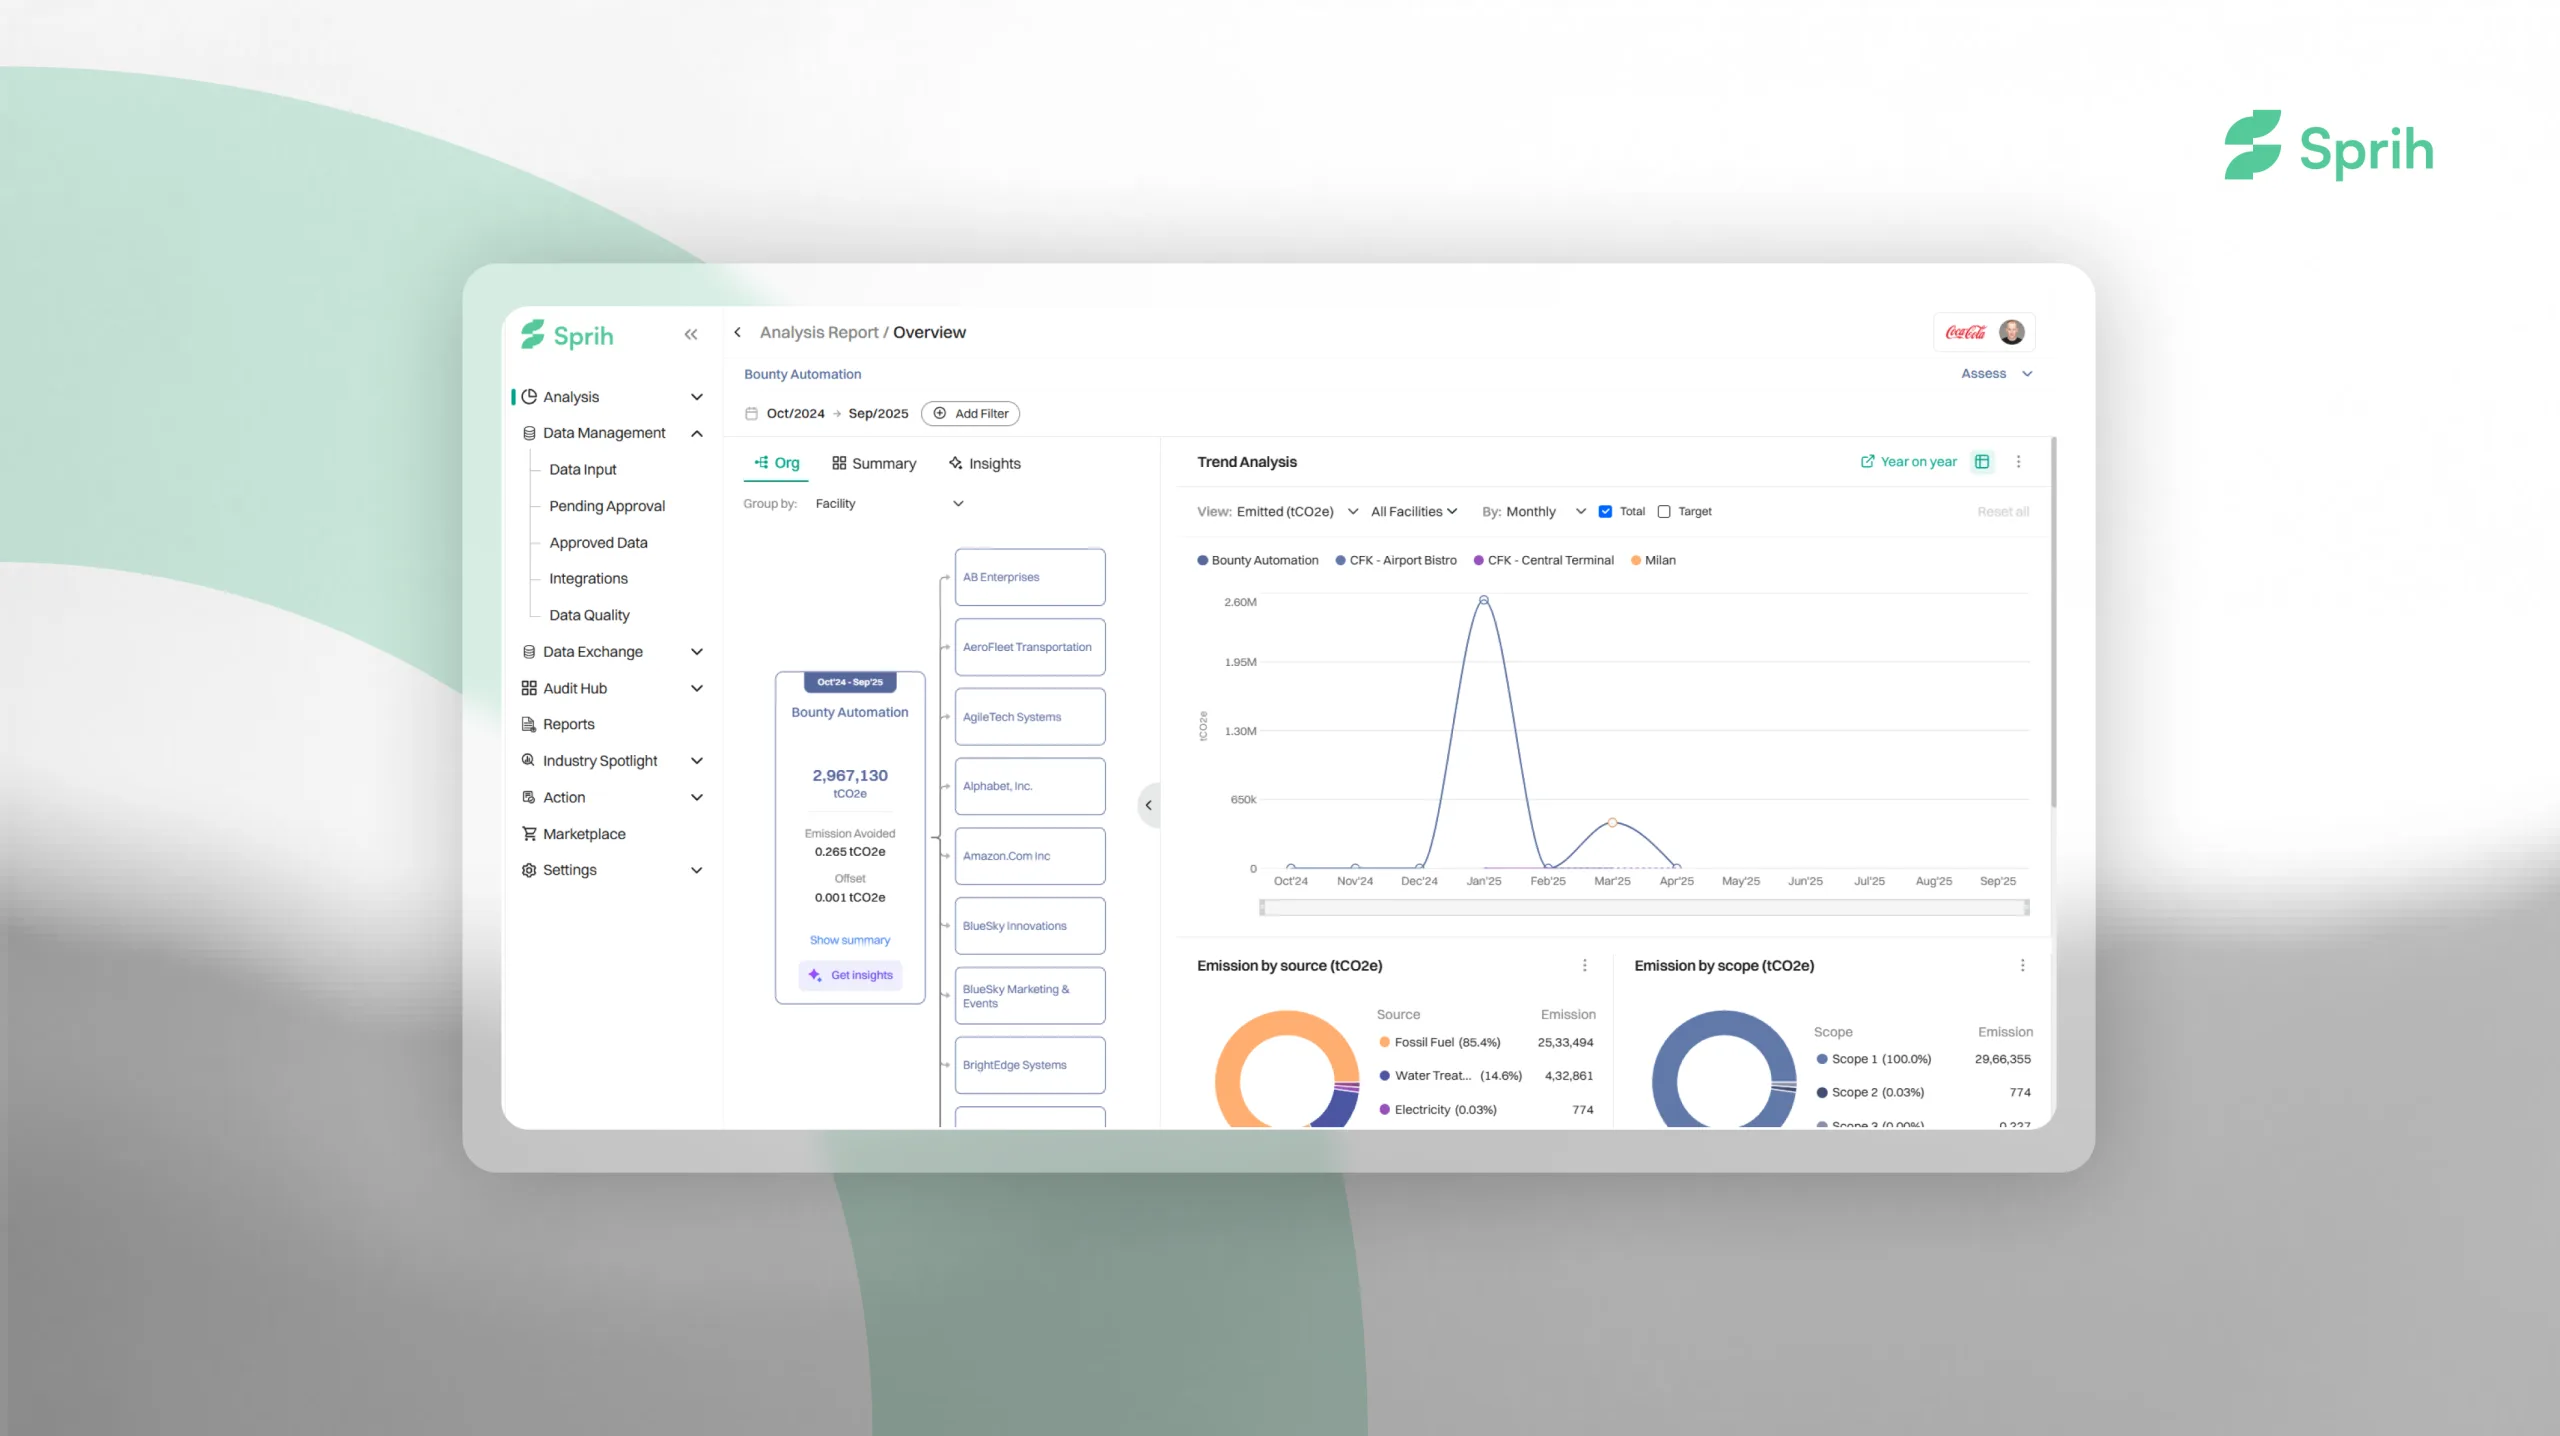
Sprih’s SustainSense AI engine automates the entire workflow:
Instead of a finance team spending 3–4 weeks per quarter reconciling travel data, Sprih delivers real-time scope 3 category 6 business travel visibility. Most importantly, it enables accurate Scope 3 reporting that survives audits and SBTi validation. Using supply chain sustainability platforms integrated with carbon accounting assessment capabilities ensures your scope 3 category 6 business travel data passes regulatory scrutiny.
Scope 3 category 6 business travel emissions are often the most data-poor, policy-weak, and overlooked part of enterprise carbon footprints. Yet for many professional services, consulting, and multinational enterprises, scope 3 category 6 business travel is 15–25% of total Scope 3—a material emissions source that demands credible measurement and deliberate reduction.
The path forward is clear: measure scope 3 category 6 business travel using activity-based methods where possible (flights, car, hotel recorded individually); combine data sources to achieve 85%+ coverage; set reduction targets aligned with travel policy changes (virtual-first, mode shifting, trip consolidation); and monitor progress quarterly. According to GHG Protocol Scope 3 Guidance and IATA Sustainable Aviation Fuel initiatives, companies actively measuring and reducing scope 3 category 6 business travel achieve a 25% reduction on average within 2 years.
The companies winning on this metric are not those making tokenistic offsets. They’re the ones treating scope 3 category 6 business travel reduction as a proxy for business model innovation—shifting to virtual-first cultures, consolidating trips, investing in rails over flights, and building decarbonization into their cost management strategies.
Ready to measure all 15 Scope 3 categories—including a defensible Category 6? Sprih’s AI-native platform auto-integrates travel data, calculates scope 3 category 6 business travel emissions with radiative forcing, and supports SBTi-aligned reporting for business travel alongside your entire Scope 3 inventory.
See how Sprih simplifies Category 6 measurement — book a demo to measure all 15 Scope 3 categories in one platform.