This quarter we focused on expanding analytical intelligence, strengthening data governance, and making sustainability operations even more intuitive. From advanced trend analysis to new roles, improved navigation, and enhanced audit transparency. Every update was built to give users clearer insights, tighter control, and a smoother experience across Sprih.
Here’s a look at how our engineering team elevated the platform in Q2.
This quarter, our analytics experience evolved significantly, giving users powerful new ways to understand data trend.
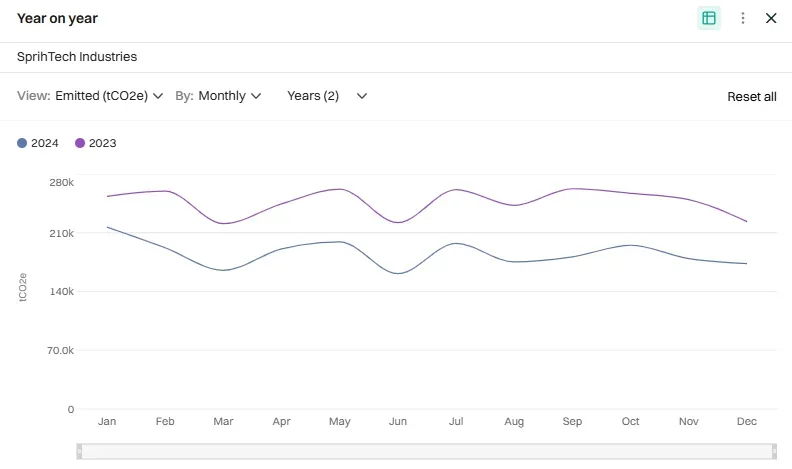
Year-over-Year Intelligence: Teams can now seamlessly compare annual sustainability data to surface shifts, progress, and patterns across reporting cycles, helping organizations contextualize performance over time.
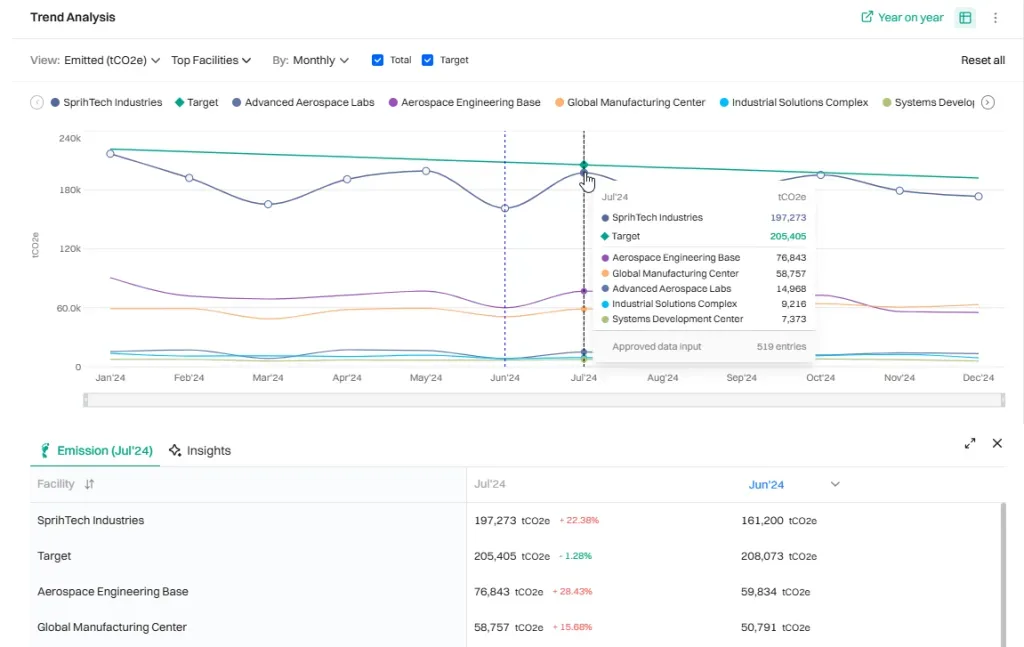
Tabular Trend Analysis: A dedicated table now showcases the underlying trend details reflected in your analytics filters, making comparisons straightforward and ensuring all insights are grounded in visible, structured data.
Goal-Tracking With Target Lines: A new target-line overlay in trend graphs helps you visually measure how emissions progress aligns with your reduction commitments — spotlighting gaps, momentum, and milestones.
Flexible Analytical View: You can now expand or collapse the organizational structure to optimize screen space, letting you examine charts and dashboards without distraction.
Quantity-Based KPI Charts: New visualizations for water and waste metrics bring clarity to volume-based KPIs, helping teams analyze resource trends more effectively.
Instant Downloads: All charts and analysis tables can now be exported directly from the menu, making reporting and presentations more effortless.
Together, these improvements create a richer, more dynamic analytical environment — one that transforms data into direction.
Smoother Workflows — Faster Entry, Better Evidence, Stronger Control
Q2 also delivered major improvements across data verification, and documentation — helping teams work more efficiently and with greater confidence.
Multiple Proofs, Fully Categorized: Users can attach several supporting documents to a record, with proof types specified for each file. This ensures better validation and stronger audit trails.
Facility Document Library: Admins can upload key facility documents directly within the facility settings, centralizing reference materials for easier review and compliance checks.
We introduced several enhancements designed to strengthen oversight and build trust in your sustainability data.
Audit Hub With Full Calculation Visibility
Users can now open detailed breakdowns of emissions, energy, and loss calculations directly from the processed data menu. This added transparency supports audits, validations, and internal QA processes.
Role-Based Access for Reviewers
Two new roles were introduced to reinforce governance:
Viewer — Read-only visibility across dashboards, data management, and the Audit Hub.
Auditor — Access limited exclusively to processed data and emission factor application details.
These roles give organizations more flexibility in how they manage access, oversight, and accountability.
Report Archival for Richer Context
Admins can now upload PDFs into the archived reports section, allowing teams and AI-driven reporting workflows to reference historical documents and maintain a comprehensive reporting record.
To reinforce user security, we introduced one-time-password (OTP) authentication via email. All users will be required to log in using an emailed OTP, ensuring stronger protection against unauthorized access and aligning Sprih with modern enterprise security standards.
A Quarter of Clarity, Control, and Confidence
With deeper analytics, streamlined data workflows, enhanced audit capabilities, and stronger access control, Q2 marked an important step in making sustainability management more insightful and secure.
These updates bring us closer to our vision: a platform that empowers every organization to measure, understand, and accelerate its sustainability performance — with intelligence, transparency, and ease.
FAQs
What was the main focus of Sprih’s Q2 2025 updates?
Q2 focused on enhancing analytical intelligence, tightening data governance, and improving overall usability. The goal was to help users gain deeper insights, streamline documentation workflows, and strengthen data security and audit transparency.
What’s new in the analytics experience?
Sprih introduced advanced features like year-over-year comparisons, tabular trend analysis, goal-tracking with target lines, and new KPI charts for water and waste. These capabilities give teams a richer understanding of their sustainability performance and make trend analysis far more intuitive.
How does year-over-year intelligence help users?
This feature allows users to seamlessly compare annual sustainability data, revealing progress, shifts, and emerging patterns across multiple reporting cycles. It helps organizations put their data in context and evaluate long-term impact.
What are quantity-based KPI charts?
Quantity-based KPI charts visualize resource usage like water and waste volumes, helping teams analyze consumption and disposal trends. They provide a clearer, data-driven view of how resource management aligns with sustainability targets.
How has documentation and verification improved?
Users can now attach multiple categorized proofs to data entries and maintain a facility-specific document library. This structure simplifies validation, centralizes compliance materials, and builds a stronger audit trail across operations.
What’s new in the Audit Hub?
The Audit Hub now offers complete visibility into calculation breakdowns for emissions, energy, and losses. This transparency supports external audits, internal reviews, and quality assurance, helping teams verify data with confidence.
What are the new Viewer and Auditor roles?
Two new governance roles were introduced:
Viewer — Read-only access across dashboards and data management.
Auditor — Access restricted to processed data and emission factor details.
These roles improve control, accountability, and audit readiness across teams.
What is the Report Archival feature used for?
Admins can upload past reports (PDFs) into a central archive, creating a searchable library of historical data. This ensures that AI-driven workflows and teams have the context needed for trend analysis and long-term performance review.
What changes were made to strengthen account security?
Sprih rolled out one-time-password (OTP) login authentication. Every user now signs in using an emailed OTP, adding a stronger layer of protection against unauthorized access and aligning with enterprise-grade security standards.
How do these updates improve the user experience?
The updates deliver smoother navigation, richer analytics, and stronger oversight — making sustainability management simpler and more secure. Together, they empower teams to measure and manage sustainability performance with greater clarity and confidence.