If your sustainability team is still managing sustainability data in Excel spreadsheets, you’re bleeding money in ways you probably haven’t quantified yet. While automation is no longer a nice-to-have, most enterprises are still stuck in the manual sustainability reporting trap—managing emissions data across disconnected tools, Excel trackers, and email threads.
The costs aren’t just about the software itself. They’re hidden across FTE time, compliance risk, data quality failures, and missed strategic opportunities. Let’s unpack the real financial burden of manual sustainability reporting and why automation delivers compelling ROI.
A recent survey found that over 70% of enterprises rely on spreadsheets as their primary sustainability data management tool, even companies with billions in revenue and complex, multi-entity operations. Why? Legacy inertia, lack of awareness, and the perception that sustainability software is overkill for smaller reporting cycles.
The problem is that sustainability data isn’t simple. It spans emissions from operations, supply chains, investments, and customer product use. It touches multiple departments—procurement, energy management, finance, HR—and each feeds data differently.
Coordinating this across spreadsheets creates bottlenecks, delays, and errors that compound with every reporting cycle.
Every sustainability report requires:
For a mid-sized enterprise with multiple entities and a complex supply chain, this easily translates to 500–1,000 hours per reporting cycle. At an average fully-loaded cost of $100–$150/hour for sustainability professionals, that’s $50,000–$150,000 per year in pure labor cost.
And this labor is reactive, not strategic. Your team spends 80% of their time gathering and cleaning data instead of analyzing trends, setting reduction targets, or advising the business.
Spreadsheets are notorious for formula errors, data entry mistakes, and version control failures. Research shows manual data entry error rates of 1–4% on average—but for sustainability data, even a 1% error can have serious consequences.
A 1% error in Scope 3 emissions might mean understating your carbon footprint by millions of tons CO2e. If your report goes to regulators, investors, or auditors, an error like that triggers:
The cost of discovering errors after publication is far higher than preventing them with validation logic and data quality checks built into the system.
sustainability reporting deadlines are tightening globally. CSRD, BRSR, and ISSB have hard filing deadlines. A missed deadline isn’t just an embarrassment—it’s a compliance violation.
Manual processes are fragile. If a supplier delays emissions data or a utilities bill doesn’t arrive, you’re scrambling. If a calculation has to be redone, you’re racing to meet the deadline.
Regulatory non-compliance can result in:
The insurance cost of regulatory risk alone justifies automation investment.
When sustainability auditors (third parties performing limited or reasonable assurance) review your data, they demand:
Manual spreadsheets rarely meet these standards. If you can’t show auditors where a number came from or how it was calculated, they’ll either:
An audit failure or qualified opinion signals to investors and regulators that your data governance is weak, which damages trust and invites further scrutiny.
Your sustainability director should be setting reduction targets, analyzing hotspots in your supply chain, and advising leadership on strategic decisions. Instead, they’re chasing down data and managing spreadsheets.
This is invisible but real: the innovation, efficiency improvements, and strategic partnerships your team could pursue instead of admin work would likely generate far more value than the cost of sustainability software.
Most enterprises don’t use one spreadsheet. They use many:
Getting a single, consistent emissions number across all sources is a coordination nightmare. Version control fails, data conflicts, and “Which spreadsheet is current?” becomes a recurring question.
The data fragmentation also makes audit preparation a nightmare. When your data lives in seven different tools, creating an audit trail is nearly impossible.
sustainability automation platforms deliver measurable improvements:
40% reduction in processing time — Data collection, validation, calculation, and report generation happen with minimal manual intervention. Your team goes from weeks to days.
30% increase in accuracy — Validation rules, automated calculations, and audit trails eliminate the majority of data entry errors.
Audit readiness built-in — Every data point has a source, every calculation has a trail. Auditors rarely request revisions or qualify their opinion.
Scope 3 automation — Supply chain emissions, the largest and most complex category, become manageable through automated supplier questionnaires, emissions databases, and AI-driven estimation.
Framework flexibility — Map one dataset to GRI, TCFD, CSRD, BRSR, ISSB, and SB 253 simultaneously. No re-work for different stakeholders.
Real-time reporting — Board-ready sustainability dashboards available on-demand, not once a year.
Your CFO thinks in terms of payback period and NPV. Here’s how to frame the case:
Year 1 Benefits:
Typical sustainability software cost: $30,000–$100,000/year for enterprise
Year 1 payback: 2–4 months
Ongoing benefits: Every year, your team gets 600 hours back that they can redeploy to strategy, reduction initiatives, or other projects. That’s renewable value every cycle.
Not all sustainability platforms are equal. When evaluating tools, prioritize:
Look for platforms that are designed for compliance and audit readiness, not afterthoughts. The best platforms treat audit trails as core architecture, not an optional module.
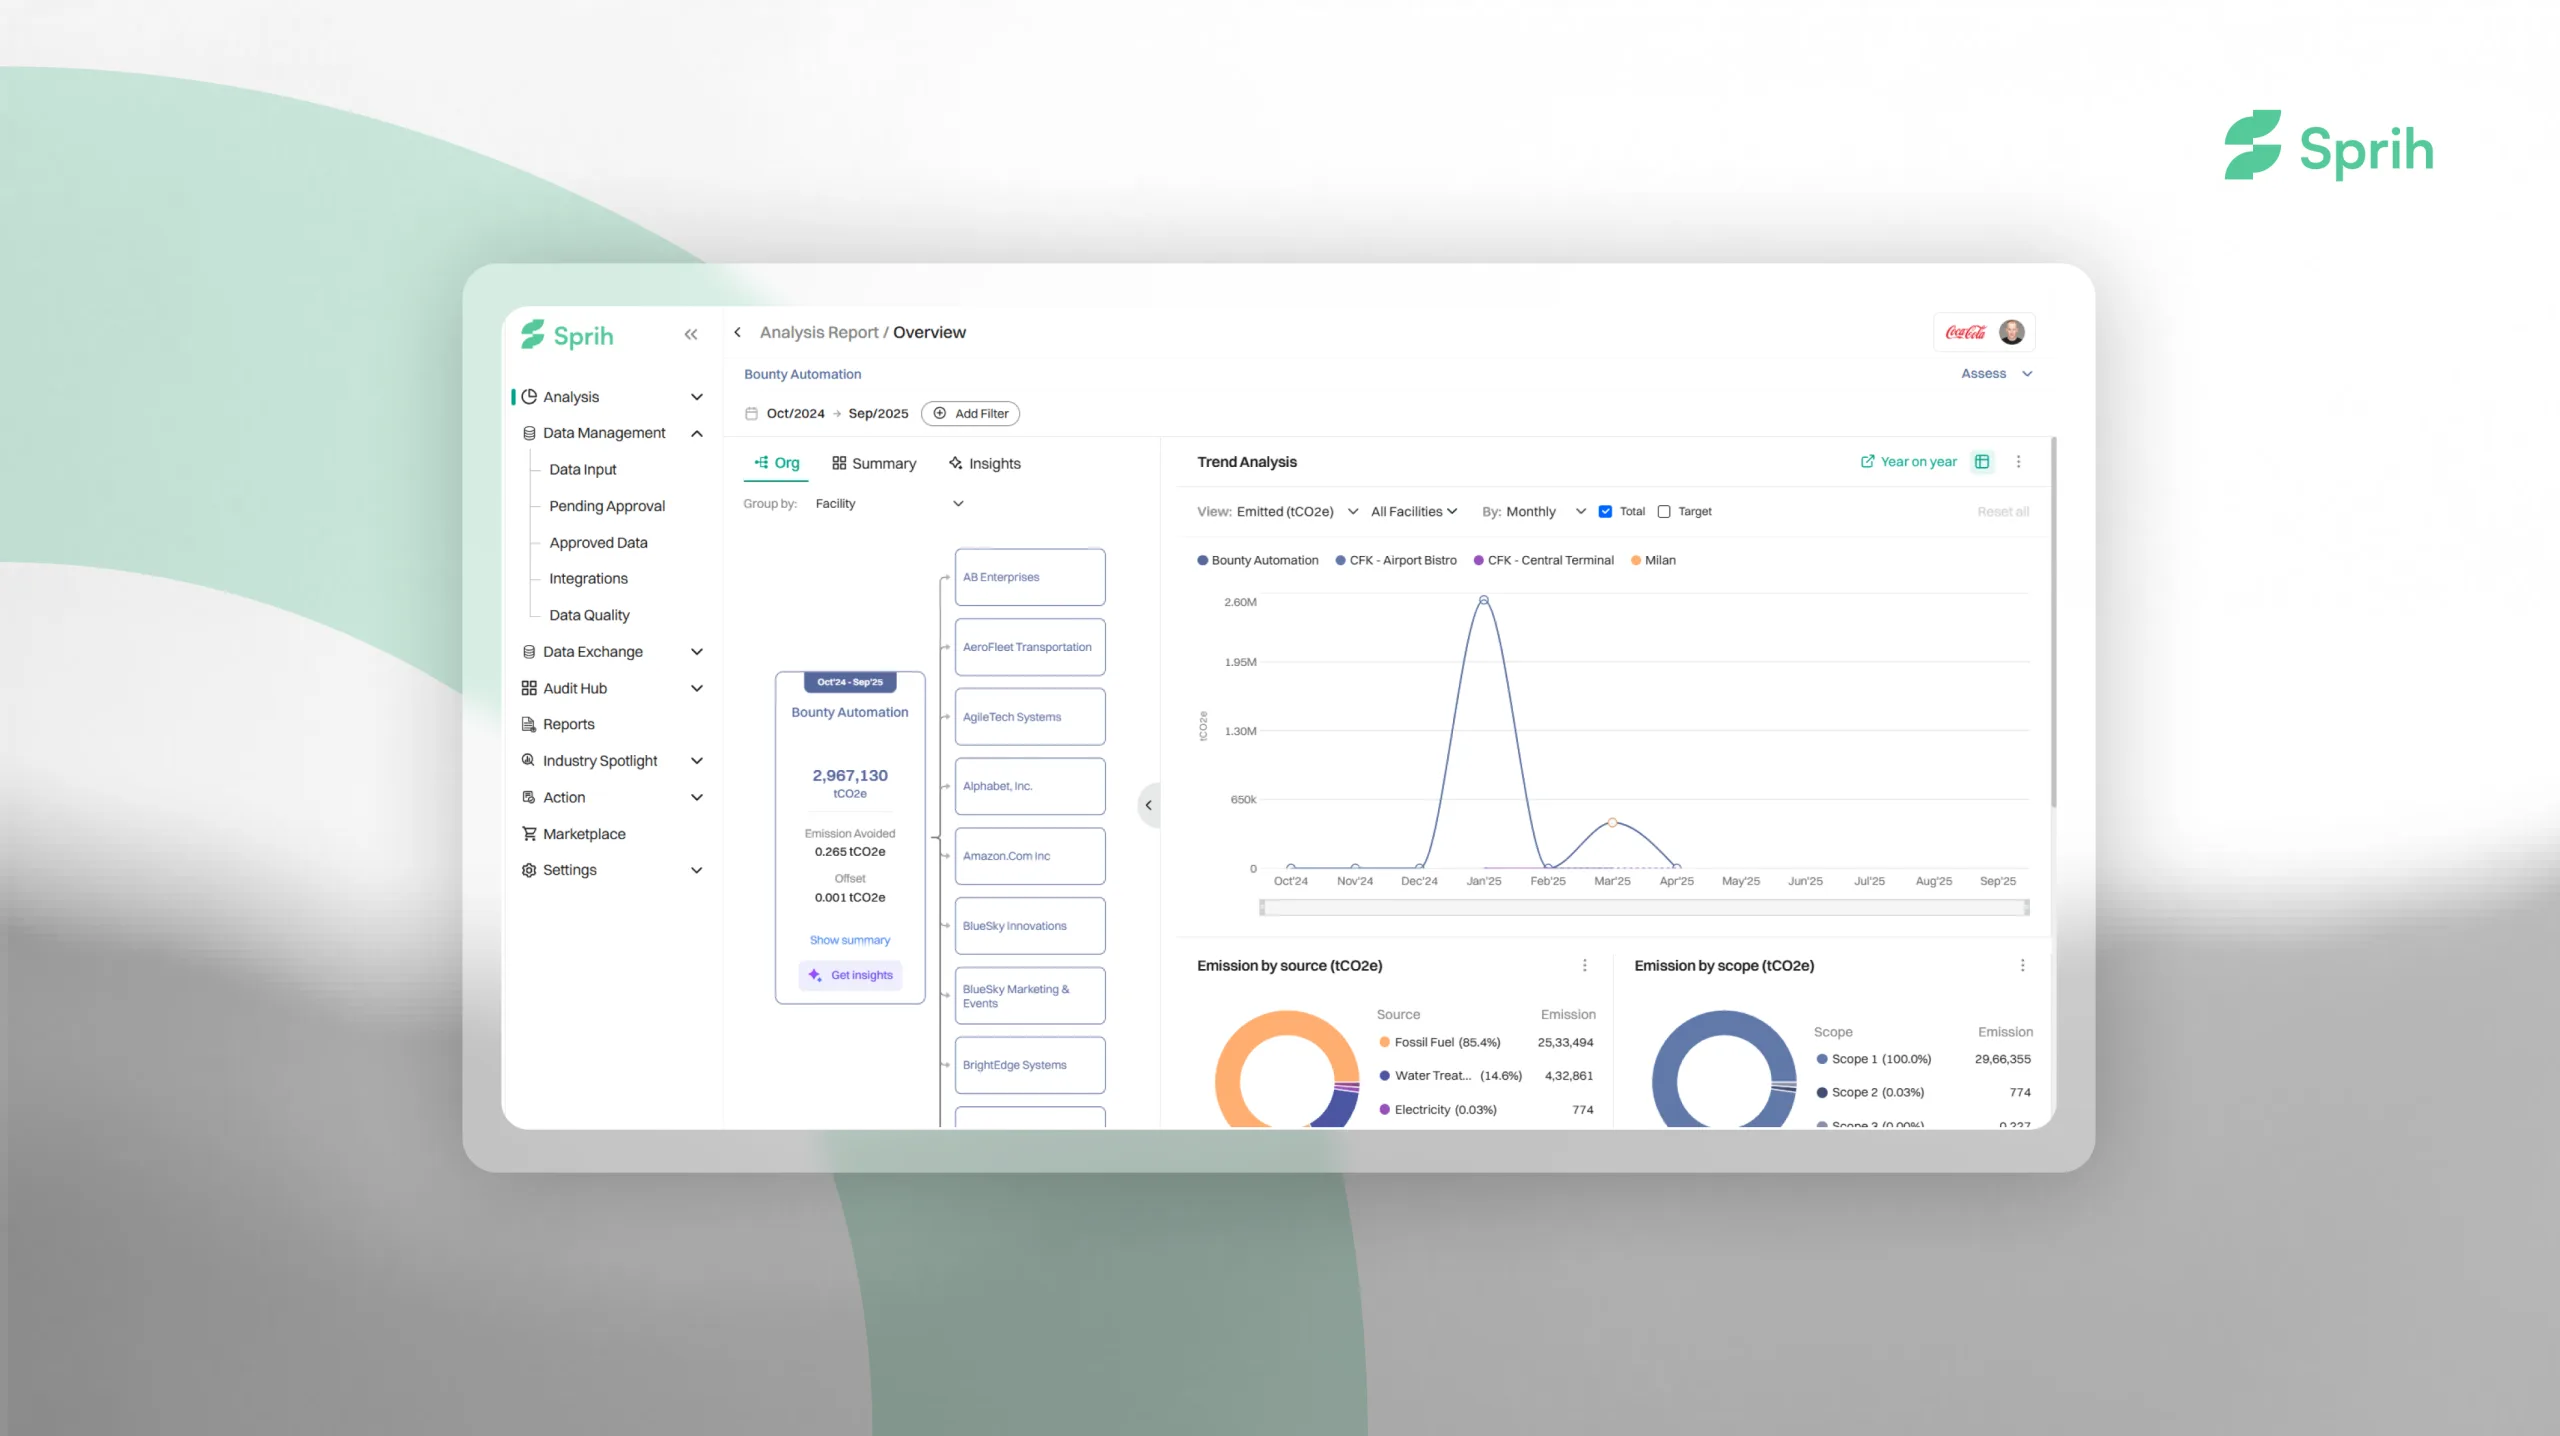
Sprih is an AI-native enterprise sustainability platform purpose-built to replace spreadsheet chaos with automated data pipelines, intelligent validation, and audit-ready reporting. The platform’s SustainSense AI engine automates data collection across Scope 1, 2, and 3 emissions, while ReportSense generates audit-ready reports mapped to CSRD, BRSR, GRI, TCFD, and ISSB frameworks in minutes, not weeks.
With full audit trail transparency and built-in compliance checks, Sprih enables sustainability teams to shift from data wrangling to strategic impact.
For more on sustainability reporting standards, see GHG Protocol guidance and GRI Standards. Learn how to move beyond manual sustainability reporting with Sprih’s SustainSense AI engine and sustainability reporting platform.
Manual sustainability reporting isn’t sustainable. Regulatory requirements are tightening, auditor expectations are rising, and investor scrutiny is intensifying. Every year you delay, the cost of the status quo grows while the cost of automation shrinks.
The question isn’t whether to automate—it’s when. The companies automating now are building competitive advantage: faster reporting, lower compliance risk, and sustainability teams that actually have time to drive reduction strategies.
Ready to calculate your sustainability reporting ROI? See how Sprih pays for itself in your first reporting cycle.