This financed emissions PCAF guide is the resource financial institutions need to accurately measure, attribute, and report portfolio-level emissions. For most enterprises, Scope 3 emissions are a component of their carbon footprint. For banks, asset managers, and insurers, Scope 3 Category 15 (financed emissions) is often the dominant emissions source—sometimes representing 95%+ of a financial institution’s total carbon footprint. Yet measuring it remains fraught with methodological complexity, data quality challenges, and competitive uncertainty.
A bank lending $1 billion to coal mining operations is responsible for millions of tonnes of financed emissions. An asset manager holding $100 billion in equities across energy, industrial, and transportation sectors carries the embodied carbon of those entire portfolios. An insurer underwriting energy infrastructure underwrites the carbon intensity of that infrastructure. In 2026, regulators, investors, and stakeholders expect financial institutions to measure and disclose financed emissions with the same rigor as operational emissions.
The standard that makes this possible is PCAF (Partnership for Carbon Accounting Financials)—your essential financed emissions PCAF guide. This guide walks you through what financed emissions are, the PCAF framework, how to measure across asset classes, and how to implement financed emissions accounting at scale.
Financed emissions are the greenhouse gas emissions of companies or projects that a financial institution finances through debt (loans, bonds) or equity investments. Unlike operational Scope 1+2 (emissions from a bank’s own offices and operations) or purchased goods and services (Scope 3 Category 1), financed emissions reflect the climate impact of the bank’s portfolio.
The GHG Protocol categorizes financed emissions as Scope 3 Category 15: Investments. The logic: a bank’s core business is deploying capital; the emissions embedded in that capital deployment are indirect consequences of the bank’s business model. They’re “owned” by the borrower or investee, but they’re the bank’s responsibility to measure and manage because the bank’s capital enables them.
Consider a typical large bank:
The ratio is 500:1 or higher. This means that reducing financed emissions by 1% has more climate impact than eliminating 100% of the bank’s office buildings.
Stat: According to the Partnership for Carbon Accounting Financials, the average large bank’s financed emissions are 1,000–10,000× larger than its operational emissions—making the financed emissions PCAF guide essential for any financial institution. For insurers and large asset managers, the ratio is even more extreme.
This reality fundamentally reshapes climate strategy for financial institutions. A bank pursuing “net zero” must decarbonize its portfolio, not just its headquarters.
PCAF is a consortium of 250+ financial institutions, standard-setters, and NGOs that developed a harmonized methodology for measuring financed emissions. Published in 2015 and updated in 2022, the PCAF standard has become the global gold standard for portfolio emissions accounting.
PCAF provides:
PCAF covers eight major asset classes:
| Asset Class | Financed Activity | Primary Data Required | Complexity |
|---|---|---|---|
| Listed Equity | Publicly traded company stocks | Company market cap; reported Scope 1+2 | Low–Medium |
| Corporate Bonds | Debt issued by large corporates | Issuer reported Scope 1+2; bond face value | Low–Medium |
| Commercial Real Estate (CRE) | Office, retail, industrial buildings | Property-level energy bills; appraisal value | Medium |
| Residential Mortgages | Home loans | Property square footage; building age; energy rating | Medium |
| Auto Loans | Vehicle financing | Vehicle fuel type, size; loan balance | Low |
| Project Finance | Large infrastructure (power plants, roads, dams) | Project design emissions; debt allocation | High |
| Loans to Companies | Corporate lending (general) | Borrower Scope 1+2; loan amount | High (requires borrower data) |
| Motor Vehicles | Leasing and fleet finance | Vehicle specs; fuel type; projected miles | Low–Medium |
Each asset class has its own calculation logic, data requirements, and pitfalls.
One of PCAF’s most valuable contributions is the data quality score—a 1–5 scale that rates the reliability of your financed emissions calculation.
| Score | Quality | Data Source | Credibility | Use Case |
|---|---|---|---|---|
| 1 – Best | Company-reported Scope 1+2; audited | Published sustainability report, audited financials | Highest; investor-acceptable | Core portfolio; disclosed companies |
| 2 – Good | Reported Scope 1+2; not audited | Public company sustainability disclosures | High; credible estimate | Large cap public equities, bonds |
| 3 – Medium | Modeled Scope 1+2; sector average | Sector benchmarks, academic databases | Medium; acceptable baseline | Mid-cap companies, SMEs |
| 4 – Fair | Proxy estimate; limited data | Industry average + assumptions | Lower; disclosed as estimate | Small-cap holdings, early-stage |
| 5 – Poor | Proxy only; high uncertainty | Sector generalization with minimal data | Lowest; use only if no alternative | Illiquid assets, emerging market SMEs |
A portfolio of 1,000 companies scored all “1–2” (company-reported data) is vastly more credible than the same portfolio scored “3–5” (modeled with sector averages). Investors, regulators, and the institutions themselves should know the difference.
Best practice: Disclose your portfolio’s data quality distribution. “Our financed emissions estimate is based on 60% company-reported data (Q1–2), 35% modeled with sector benchmarks (Q3), and 5% proxy estimates (Q4–5).” This transparency builds credibility and shows your measurement rigor.
Here’s the measurement problem: large, publicly traded companies (which report Scope 1+2) represent 30–40% of global lending and investment. The remaining 60–70% (SMEs, private companies, emerging market borrowers) don’t report emissions. Financial institutions must either:
PCAF provides tools to navigate these trade-offs, but they remain real constraints.
PCAF offers three primary calculation methodologies, depending on asset class and data availability:
Used for: Listed equity, corporate bonds, corporate loans
Logic: You finance a percentage of a company; you account for the equivalent percentage of that company’s emissions.
Formula:
Financed Emissions = Company Scope 1+2 Emissions × (Your investment value / Company market cap)
Example: Your bank owns $10M in shares of XYZ Energy Corp, which has market cap of $2B and Scope 1+2 emissions of 500,000 tonnes CO₂e.
Financed Emissions = 500,000 tonnes × ($10M / $2B) = 2,500 tonnes CO₂e
You’re responsible for 0.5% of XYZ’s emissions (matching your 0.5% equity stake).
Used for: Loans, bonds, project finance
Logic: You finance a portion of a company’s capital structure; you account for the proportional emissions.
Formula:
Financed Emissions = Company Scope 1+2 Emissions × (Loan amount / Total company funding)
Example: Your bank makes a $100M loan to ABC Manufacturing, which has:
Your financed emissions = 1M tonnes × ($100M / $1B) = 100,000 tonnes CO₂e
Used for: Real estate, vehicles, project finance
Logic: Measure the underlying asset’s carbon intensity; multiply by your financed portion.
Formula:
Financed Emissions = Asset emissions per unit × Asset units × Your financing share
Example (Commercial Real Estate): Your bank finances a $50M mortgage on a 500,000 sq ft office building. Average office buildings emit 0.05 tonnes CO₂e per sq ft annually (including Scope 1 heating, Scope 2 electricity).
Financed Emissions = 0.05 tonnes/sq ft × 500,000 sq ft × 100% ownership = 25,000 tonnes CO₂e
For a $25M co-investment (50% of the $50M total), you’d account for 12,500 tonnes.
Scenario: Your bank makes a $500M loan to GreenSteel Manufacturing (market cap $5B, reported Scope 1+2: 2M tonnes CO₂e annually).
Calculation (Debt Attribution Method):
Data Quality Score: Q2 (company-reported Scope 1+2 from sustainability report; unaudited)
Scenario: Your asset manager holds a $100B portfolio across 500 companies. Top holding: XYZ Tech (market cap $1T, Scope 1+2: 5M tonnes, your stake $5B).
Calculation (Equity Share Method):
Data Quality: Weighted average of Q1–2 (large caps report) and Q3–5 (SMEs use proxies)
Scenario: Your bank’s $5B CRE lending portfolio spans 100 properties, averaging 250,000 sq ft per property.
Calculation (Physical Intensity Method):
Data Quality: Q3 (sector averages; individual property energy data not available)
If your bank has signed the NZBA commitment, you must:
Over 330 banks globally have committed to NZBA, representing $100+ trillion in assets. This is regulatory-grade obligation, not optional.
TCFD requires disclosure of:
Stat: As of 2026, 63% of large global banks (>$100B AUM) now disclose some financed emissions metric. Disclosure has become competitive baseline.
Error: You report total Scope 1+2+3 of all portfolio companies as if it’s your financed emissions. It’s not.
Correct approach: Attribute only your proportional stake. If you own 2% of a company, you account for 2% of its emissions, not 100%.
Error: A manufacturing company’s Scope 3 (supply chain) is already included in its reported Scope 1+2 (no, it’s not). You mistakenly add it again.
Correct approach: Reported Scope 1+2 doesn’t include Scope 3. If you want to account for a borrower’s supply chain emissions (sometimes appropriate for scope completeness), explicitly model it. Don’t double-count.
Error: You calculate financed emissions using a company’s 2020 emissions report (most recent available) in 2026.
Correct approach: Use the most recent available data; flag data quality accordingly. A Q5 estimate is better than a 6-year-old Q1 data point. Recalibrate annually.
Error: You report “Portfolio financed emissions: 50M tonnes CO₂e” without disclosing that 60% is Q4–5 proxy estimates.
Correct approach: Disclose data quality distribution. “50M tonnes CO₂e: 35% company-reported (Q1–2), 45% modeled (Q3), 20% proxy (Q4–5).”
Error: You commit to “reduce financed emissions 30% by 2030” but don’t specify:
Correct approach: Be explicit. “Reduce financed emissions from our 2022 baseline $X by 30% by 2030. Scope: loans >$10M to corporate borrowers in OECD markets. Baseline includes all outstanding loans at end of 2022; new loans issued post-baseline are managed separately.”
Error: You weight a Q1 company-reported Scope 1+2 the same as a Q5 sector proxy in your portfolio average.
Correct approach: Recognize data quality tiers. Consider weighting by both data quality and portfolio weight. A $100M loan with Q1 data should influence targets more than a $10M loan with Q5 data.
Financed emissions accounting at scale—across thousands of borrowers, multiple asset classes, and annual recalibration—is operationally complex without proper platform support. Manual spreadsheets break down at 500+ borrowers; accuracy deteriorates with data scattered across systems.
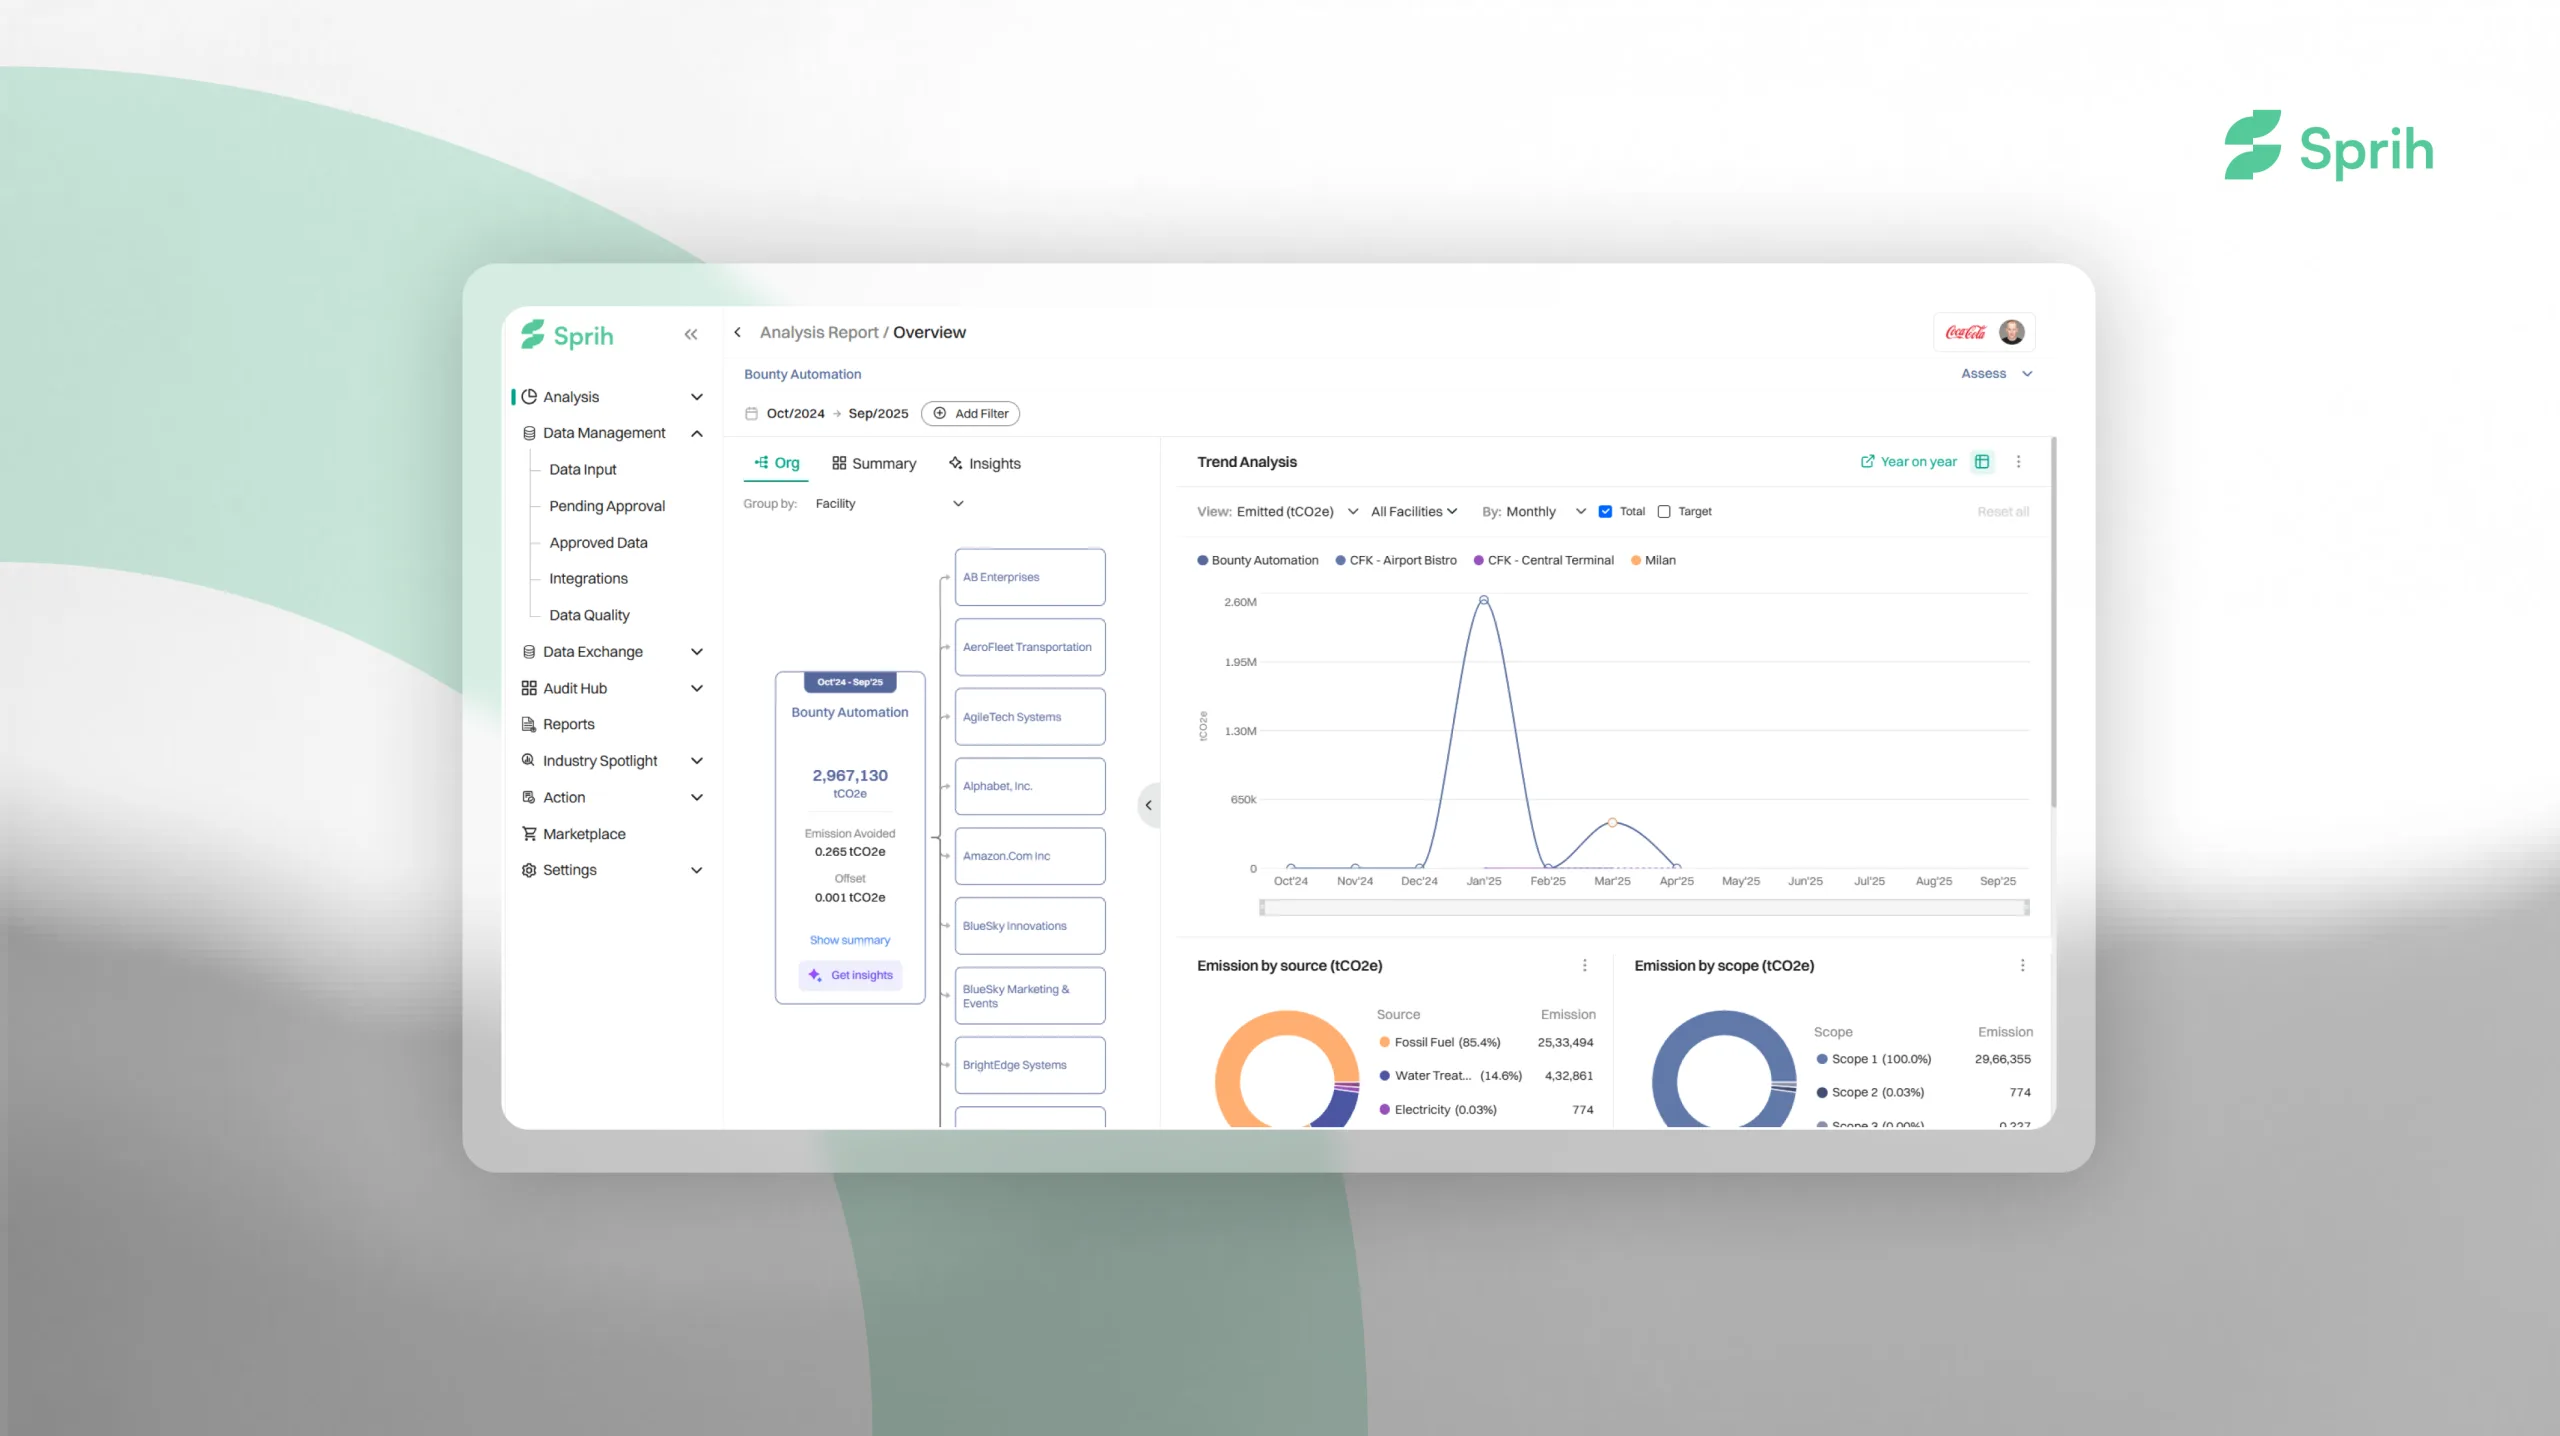
Sprih’s enterprise platform for financial institutions provides:
Most importantly, Sprih enables financial institutions to measure financed emissions as a live, updated metric—not a static annual calculation. When a borrower’s Scope 1+2 changes, your portfolio estimate updates. When you originate a new $500M loan, financed emissions impact is immediately visible. The AI-native sustainability platform and SustainSense AI engine integrate seamlessly with loan systems to automate PCAF-compliant financed emissions PCAF guide calculations.
Financed emissions (Scope 3 Category 15) have become the defining emissions source for financial institutions. Measuring them credibly requires understanding the PCAF standard in your financed emissions PCAF guide, choosing appropriate calculation methodologies for each asset class, and maintaining rigorous data quality tracking.
The institutions winning on financed emissions measurement are not those publishing impressive net-zero targets with weak underlying data. They’re the ones being transparent about data quality, setting ambitious borrower engagement strategies, and integrating financed emissions into lending decisions and capital allocation. According to PCAF Official Site and NZBA Net Zero Banking Alliance research, financial institutions with mature financed emissions PCAF guide implementation report 40% faster portfolio decarbonization.
In 2026, financed emissions PCAF guide implementation is no longer optional for banks, asset managers, and insurers. It’s the foundation of credible climate strategy and regulatory compliance.
Ready to implement portfolio-wide financed emissions accounting using the financed emissions PCAF guide? Sprih’s platform is purpose-built for financial institutions to measure across asset classes, maintain PCAF-aligned data quality, and support NZBA and regulatory disclosures at scale.
Request a demo with a financial institution specialist to see how Sprih helps you calculate, track, and reduce financed emissions across your entire portfolio.