Scope 3 category 4 upstream transportation emissions represent one of the most overlooked — yet most significant — components of a company’s value chain footprint. When most companies think about their carbon footprint, they focus on what happens inside their four walls: manufacturing facilities, company vehicles, and office buildings. These are Scope 1 and Scope 2 emissions, and they’re relatively straightforward to measure.
But for the vast majority of enterprises, the largest source of emissions is Scope 3—the upstream and downstream value chain. Within Scope 3, one category often flies under the radar: Category 4, Upstream Transportation and Distribution.
Category 4 emissions represent a $2 trillion opportunity for the global economy to decarbonize logistics—and it’s far more material than most companies initially think. A Fortune 500 manufacturer might discover that their Scope 3 Cat 4 emissions are larger than their combined Scope 1 and 2 emissions. Yet they have no systematic way to track or reduce them.
This guide walks you through exactly what Category 4 covers, how to calculate scope 3 category 4 upstream transportation emissions, where the data challenges lie, and how to turn logistics transparency into competitive advantage.
According to the GHG Protocol, Scope 3 Category 4 encompasses upstream transportation and distribution services of purchased goods and services between suppliers and your facilities. In plain English: every ton of CO₂ emitted by trucks, trains, ships, and planes moving your purchased goods before they arrive at your warehouse or manufacturing facility.
This includes:
What doesn’t count as Category 4:
The boundary is critical: Category 4 is specifically the transportation and distribution your suppliers and logistics partners perform to get goods to you.
Here’s where most companies get blindsided.
The average consumer product moves through 5-7 logistics touchpoints before reaching your facility. A retail company buying from Asian suppliers ships goods via container ship (low-carbon per ton-km, but high total volume), then transfers to rail or truck for inland distribution. A pharmaceutical company buys active ingredients from multiple suppliers globally, aggregates them in regional distribution centers, then transports them to manufacturing facilities.
The emissions add up fast. For a consumer goods manufacturer importing goods from Asia and distributing across North America, Scope 3 Category 4 can represent 15-25% of total Scope 3 emissions. For a retailer buying finished goods from multiple suppliers, it’s often 30-40% of Scope 3.
Yet most companies have zero visibility into these emissions. Here’s why:
The result: companies report Scope 3 Cat 4 using spend-based estimates rather than actual logistics data. And spend-based estimates are often wrong because:
The GHG Protocol offers three calculation approaches. Understanding each helps you pick the right one for your business.
Calculate Category 4 emissions by multiplying your spending on upstream transportation services by an emission intensity factor (kg CO₂e per dollar spent).
Formula: Emissions = Amount spent on transportation services × Emission factor per dollar
When to use it:
Limitations:
Example: You spend $50M annually on third-party logistics. The EPA emission factor for trucking is approximately 0.13 kg CO₂e per dollar of freight services. Estimated emissions: 50M × 0.13 = 6.5M kg CO₂e (6,500 MT CO₂e).
The problem: this doesn’t account for whether your freight moved by truck across North America (high-carbon) or by ship across the Pacific (low-carbon). Your actual emissions could be 30% higher or lower.
Multiply the weight of goods shipped by the distance traveled by the mode of transportation, then apply mode-specific emission factors.
Formula: Emissions = (Weight shipped × Distance traveled × Emission factor per ton-km) by mode
When to use it:
Data you need:
Example: You import 100 tons of goods from Shanghai to Los Angeles by container ship, then truck it inland 1,000 miles to your facility in Denver.
Compare that to if you’d air-freighted the same goods:
The air option would generate 7.6x more emissions. This is why visibility into transportation mode is critical.
Calculate emissions based on actual fuel consumption of transportation vehicles, applying emission factors specific to fuel type.
Formula: Emissions = Fuel consumed × Fuel-specific emission factor
When to use it:
Data you need:
This approach is most useful for companies managing their own fleet transportation. For third-party logistics, you’d need your carriers to provide actual fuel consumption data, which most don’t track or share.
Choosing a calculation method is one thing; actually getting the data is another. Here’s what works in practice.
Map where Category 4 data currently lives:
The cleanest data comes directly from those doing the transportation. Develop a request template asking for:
Make it easy: provide a simple Excel template. Most suppliers will fill it out if you explain why you need it (compliance, reduction targets, customer requirements).
For companies with material Category 4 emissions, manual data collection doesn’t scale. You need:
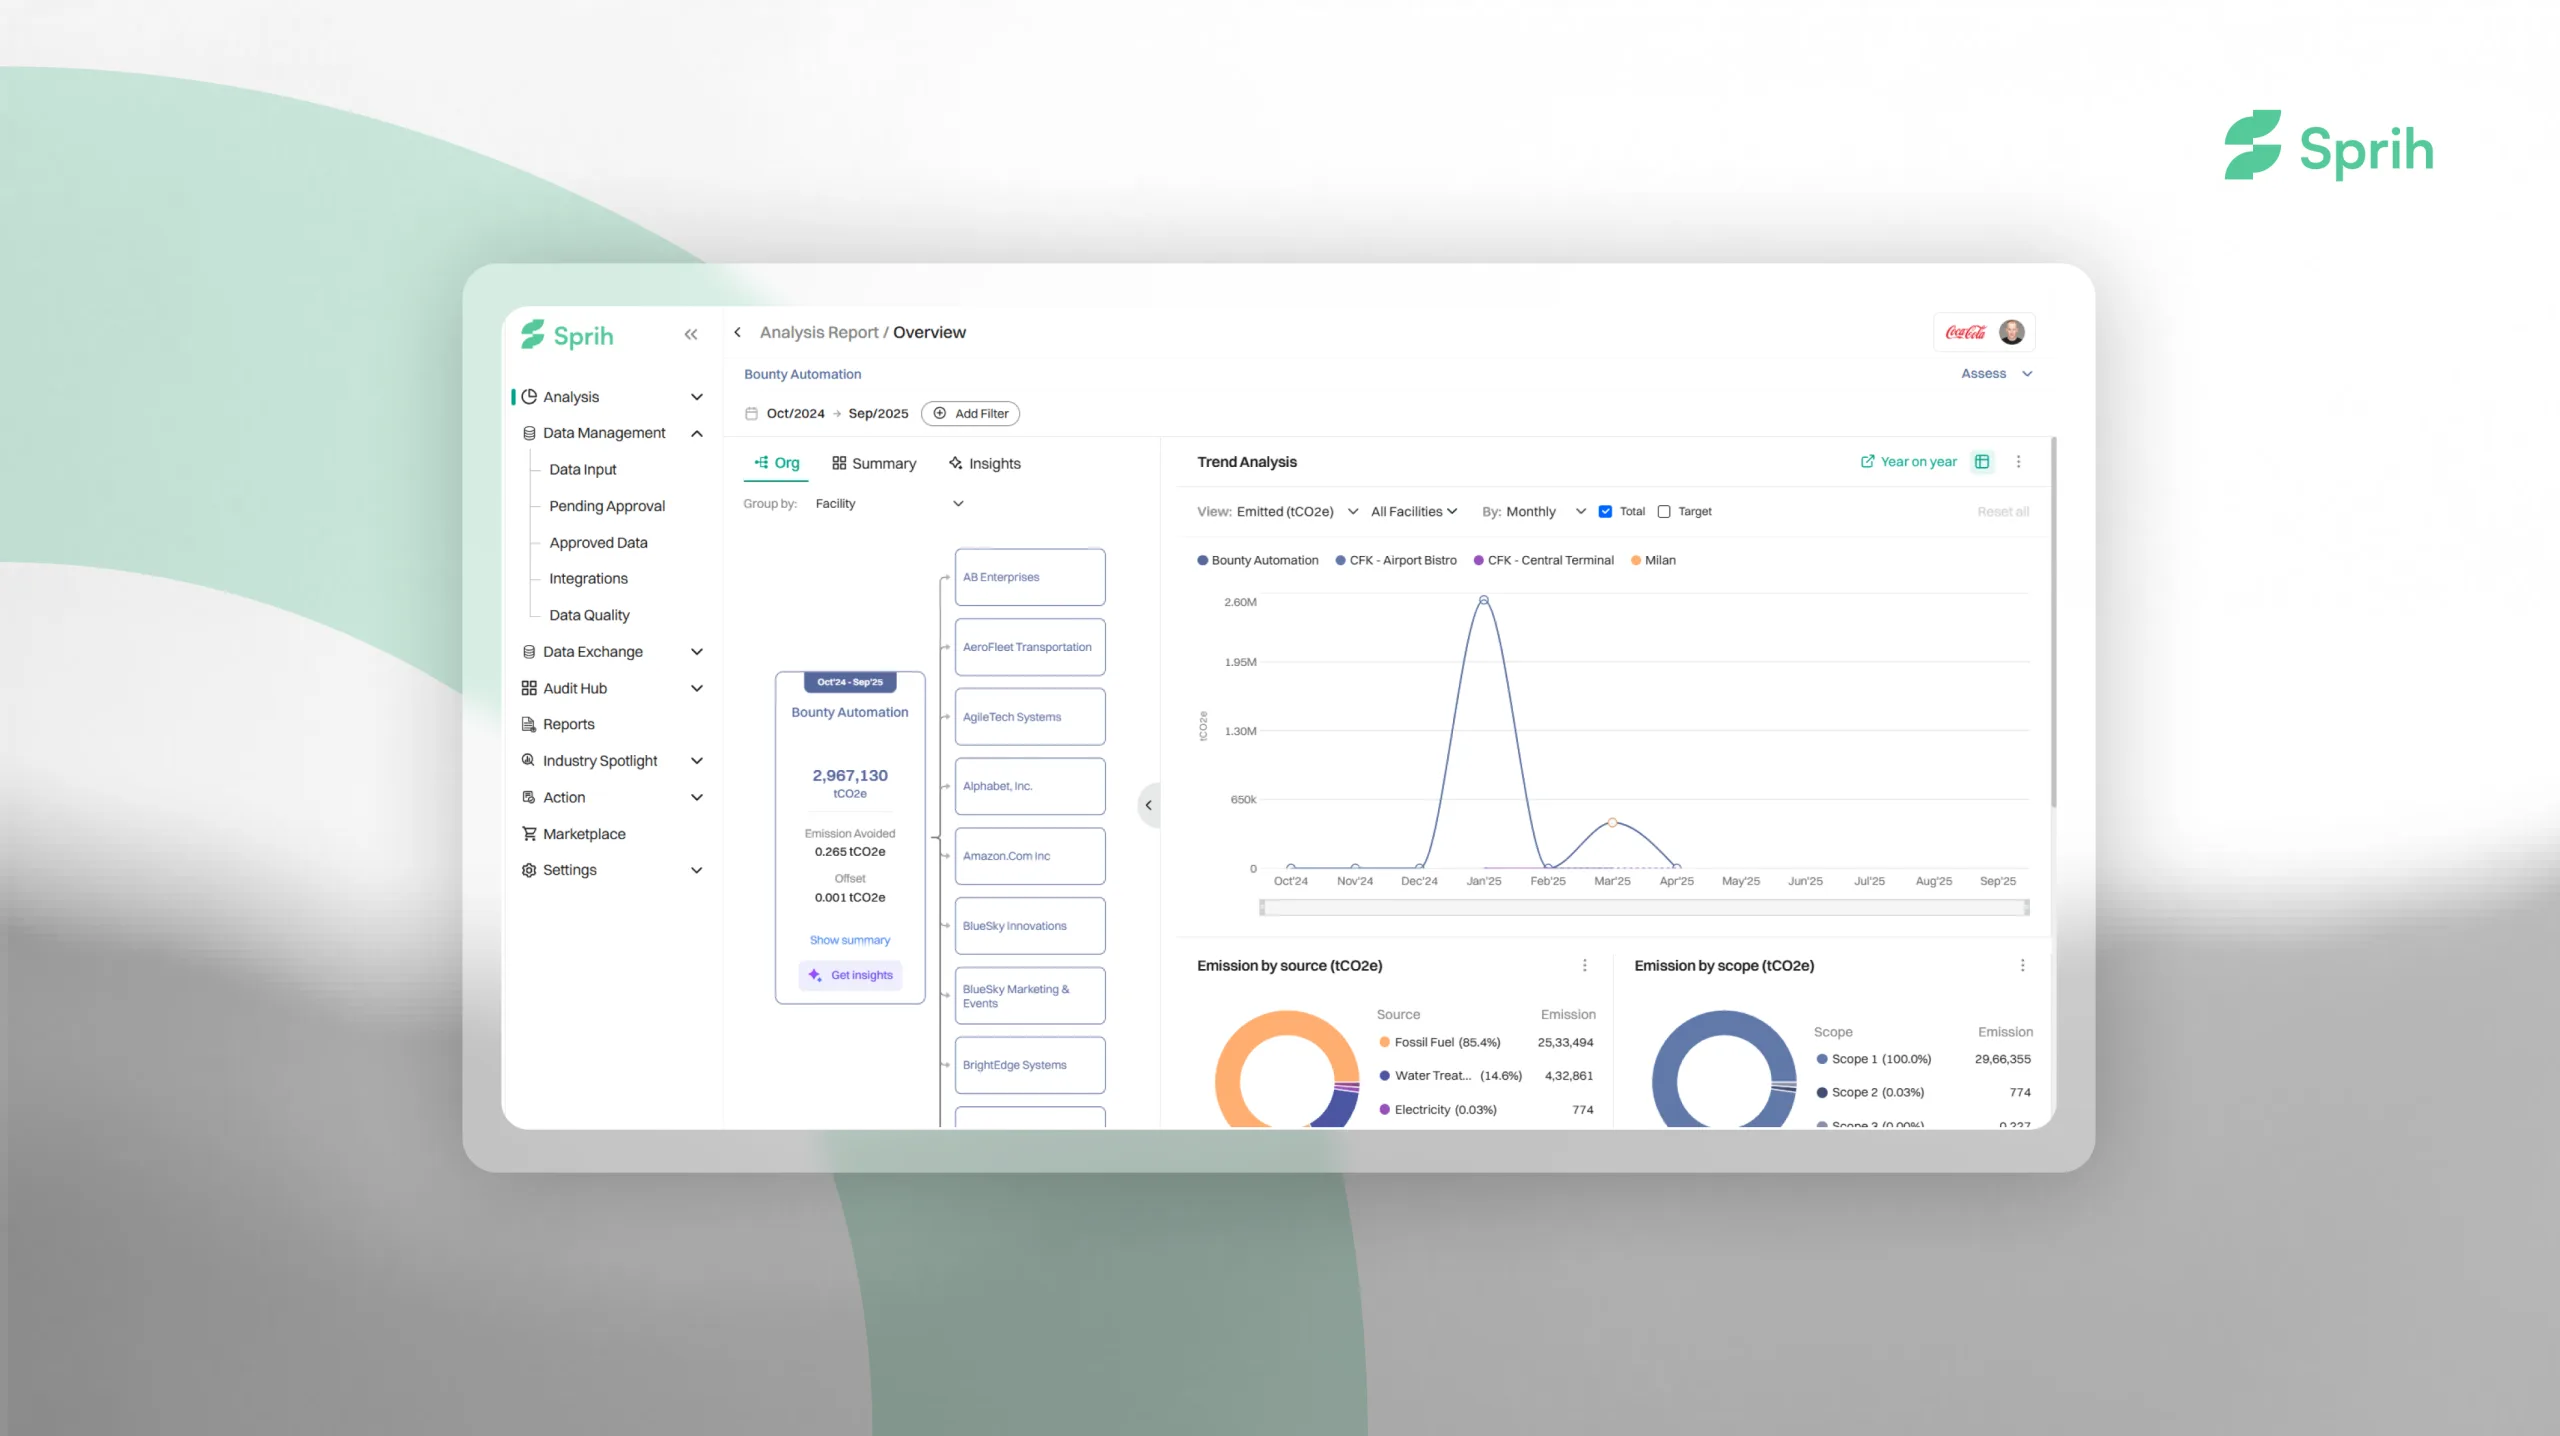
Platforms like Sprih automate this by connecting to your ERP, shipping databases, and logistics partner APIs, then automatically applying GHG Protocol calculation rules without manual intervention. This reduces data collection time from 8-12 weeks to 2-3 weeks, and catches errors that manual processes miss. Using supply chain sustainability specialized platforms and carbon accounting assessment tools ensures that your scope 3 category 4 upstream transportation emissions baseline meets audit standards.
Consolidate shipments: Small, frequent shipments are more carbon-intensive per unit than consolidated containers. Calculate a weighted-average emission factor for your typical shipment and apply it to volume estimates if you can’t track individual shipments.
Account for empty backhauls: Trucks often return empty. Some carriers inflate weight-based calculations by 15-20% to account for this reality.
Use primary data where it exists: If a major supplier or logistics partner provides actual transportation data, use it. These are typically more accurate than proxy estimates.
Track modal shifts: If you shift from air to sea freight (a common reduction tactic), your emissions factor drops by ~80%. This is why visibility into actual modal choices matters.
Update annually: Last year’s shipping patterns won’t match this year’s. Update your Category 4 baseline annually, and track trends. If inland freight grew 40% while you only grew 20% in revenue, something’s inefficient.
Once you have visibility, reduction opportunities emerge:
The first step is visibility. Measure, then you can improve.
Scope 3 category 4 upstream transportation emissions represent a blind spot for most enterprises—and a massive opportunity for those who gain visibility. Transportation and distribution of purchased goods can represent 15-40% of total Scope 3 emissions for many industries. Yet most companies manage this category with crude spend-based estimates rather than actual logistics data.
The companies winning on decarbonization are the ones building supply chain transparency. They understand their actual transportation modes, distances, and carriers. They can calculate realistic emission factors, identify high-impact reduction opportunities, and measure progress annually. According to the GHG Protocol Scope 3 Calculation Guidance and IEA Transport Data analyses, companies with visibility into scope 3 category 4 upstream transportation emissions reduce supply chain carbon by an average of 18% annually.
Ready to get visibility into your Scope 3 Category 4 emissions? Start by mapping your data sources and identifying your major suppliers and logistics partners. Then move to systematic data collection using distance-based or fuel-based approaches.
Book a consultation with Sprih to see how our platform automates Scope 3 Category 4 data collection and gives you the visibility to drive real reductions in your supply chain.